Event Chain Diagram - Definition & Meaning
What is Event Chain Diagram?
An event chain diagram is constructed to get a visual representation of the various events and functions and the linkage between them. It is a very common tool used by managers to evaluate the timely project completion feasibility. They depict the impact of various global and local events on the project schedule, and thus help managers understanding the effects and managing the project effectively in advance. An event chain diagram is generally completed after PERT and Critical path analyses are completed.
An Event chain diagram is typically constructed on a Gantt chart and some of the rules are:
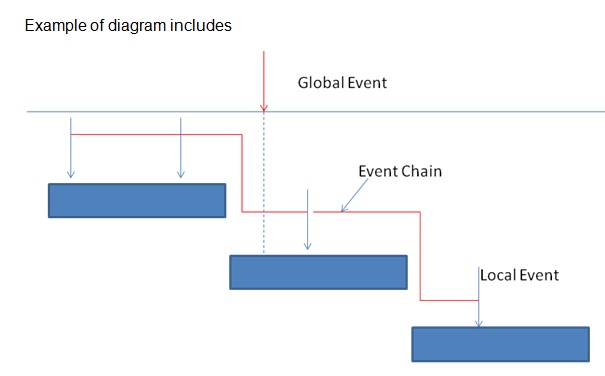
- An event is represented by an arrow
- Downward arrow represents an event having negative impact (risk) while the upward arrow represents the one having a positive impact
- An event chain is represented by the lines connecting the individual events.
- Global events are typically shown outside the chart while the local ones are shown inside
A detailed event chain diagram can be quite useful in delineating the strategy to deal with complex problems that might befall the project.
Example of diagram includes
This article has been researched & authored by the Business Concepts Team. It has been reviewed & published by the MBA Skool Team. The content on MBA Skool has been created for educational & academic purpose only.
Browse the definition and meaning of more similar terms. The Management Dictionary covers over 1800 business concepts from 5 categories.
Continue Reading: