Sales Report - Definition, Importance, Types, Steps & Example
What is Sales Report?
Sales Report is a comprehensive document which analyses all the sales activities of a company through various parameters, KPIs and dimensions pertaining to the sales volume, revenue, team performance, opportunity pipeline etc. Sales report also describes the record of all the calls which have been made and products that have been sold during a particular time frame by a salesperson or the management.
Importance of Sales Reporting
A sales report shows what all trends are occurring in a company's sales volume over time i.e. it shows whether the sales are increasing or declining. This report can be analyzed by the sales managers to decide the best course of action like to identify market opportunities and areas where sales volume could possibly be increased. The company’s sales can be shown for a quarter or a year.
A small-business manager is usually more interested in breaking sales down depending upon the location or product.
It contains details like Time period, Sales summary, Sales by Format, Sales by Category, Report Preferences, News & Updates, FAQs, Overview etc.
Sales Report Types
Sales report consists of various reports which are very important to a company. Some of them are:
1. Sales Volume
This report shows how much volume of a product group was sold in the particular time frame. This mainly is represented in number of units sold for that product.
2. Sales Expenses
Sales expenses report would show the expenses incurred in the process making the sale or qualifying leads. These would include reimbursement expenses, travel costs etc.
3. Sales Funnel Overview
This report shows the sales funnel as per the stages of the sales cycle. It also shows the percentage conversions at each stage. If the percentage of conversion at each stage are falling a lot, it can help the team to identify the issues
4. Sales Team performance
This report would include the overall performance and target evaluation of the sales team. Parameters like percentage of conversions, sales calls made, overall meeting of targets etc. would be included in this part.
5. Opportunity Pipeline, Wins and Forecast
This report shows the opportunities which are close to be converted to quote to orders with probability in percentages.
The opportunity pipeline helps the team to plan and forecast better.
6. Key Accounts Performance
For B2B companies, there can be many accounts where a lot of business will be done in terms of volume and dollar value. These are the key accounts for the business and need to analyzed regularly for customer management.
7. Sales Quality
This report would include the overall quality of the sales process across different steps and stages. This shows how much time it takes from lead to opportunity conversion or quote to order closure. Overall this report would show the quality of the processes followed and can help identify bottlenecks and help improve them.
Sales calls data is included in this report to show how many meetings and calls were done by the sales team with potential and existing clients.
8. Summary Dashboard
Many a times Sales report is required for senior management analysis. A summary dashboard of the entire sales processes, data and KPIs can help see the performance, trends and issues with sales.
Steps to create a Sales Report
1. Collect, compile and validate all the sales data from various systems, teams and departments to ensure that the entire picture can be created.
2. Identify the parameters, KPIs and reports which are required
3. Identify the interval for the sales report creation e.g. weekly, monthly, yearly
4. Select the geographies or the product groups required for the report.
5. Decide on the detail level based on whether the report is for senior management or not. Senior management would want less detail and more insights
6. Finalize on the format. The format can range from a dashboards to spreadsheets depending upon the detail and need of the report.
7. Validate the numbers as the sales data is very critical to any business
Sales Report Example and Format
Let us take an example of a weekly sales report with sales volume.
| Product/Sales Volume | W1 | W2 | W3 | W4 | W5 | W6 | W7 | W8 |
| Refrigerator | 2000 | 2002 | 2008 | 1900 | 1950 | 1800 | 1900 | 1908 |
| Television | 4500 | 4530 | 4900 | 5500 | 5000 | 4800 | 4700 | 4400 |
| Air Conditioner | 700 | 680 | 690 | 710 | 705 | 580 | 540 | 450 |
| Vacuum Cleaner | 200 | 190 | 180 | 194 | 202 | 200 | 195 | 198 |
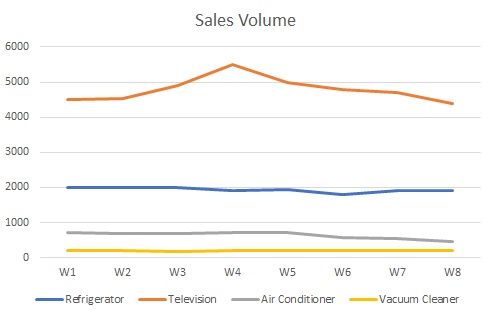
In the above example we see that how different product groups performed in terms of sales volume over a span of 8 weeks. We can see that AC sales we good till Week 5 and then suddenly started to fall. It may be due to climate change.
We also see a trend in TV in which around Week 3 to week 5 the sales started rising due to a sporting event but then it started falling to levels of Week1.
This is an example which can be used for a sales report with focus on sales volume. A complete sales report will have multiple tables of the same.
Hence, this concludes the definition of Sales Report along with its overview.
This article has been researched & authored by the Business Concepts Team. It has been reviewed & published by the MBA Skool Team. The content on MBA Skool has been created for educational & academic purpose only.
Browse the definition and meaning of more similar terms. The Management Dictionary covers over 1800 business concepts from 5 categories.
Continue Reading: