How to make a great PPT for Business
PPTs are an integral part of business these days, whether you are working in any sector or still in your B-school or college. You need Power Point Presentations's right from your college assignment to your job. You may have to present it to a single stakeholder or to an auditorium full with audience. There is no right or wrong way to make a PPT but there are few points which we can keep in mind while making PPTs. Here are few points you can keep in mind while making your next PPT great.
1) Basics of creating outstanding slides
Title-Kicker-Body

Slides should have a proper Title, Kicker (main message of the slide) and Body part. Titles help us to locate where we are situated in the presentation flow. Titles should be named effectively such that just by reading titles of slides- anyone can figure out the entire flow of presentation. Titles should ideally never exceed more than one line. Titles should follow the same design pattern, font type, font size across the entire presentation. Kickers give us the key messages in each slide. While writing kickers- don’t describe what is explained by graphics, emphasize mainly on the key message which we want our audience to get from the slide. Body text is that larger portion of slide which helps us to tell complex and detailed story in a simple, understandable way. Always prefer bullet points. Make 3-4 logical statements only. Don’t fill up the entire space with text. It’s definitely okay to leave some blank space on slide.
2) Agenda of the Presentation
Always have a fixed agenda for your presentation. It should be the main and ideally the opening slide to start your presentation with. Divide your entire presentation in certain keywords/topics ( It can be ranged from 04 to 07 points) and make slides accordingly. You can have this keywords mentioned in Agenda slide as your Titles in rest of the slides. Use innovative ways to present your Agenda slide. Certain examples are shown in images below.

Better way of presenting same 4-5 keywords/Agenda in Moving Smart-Art format. With use of similar Smart Arts available in Microsoft Powerpoint you can list down all your Titles and can draw conclusions from it. Because of moving color object in upper most part of your slide, your audience will be with you throughout your presentation flow.

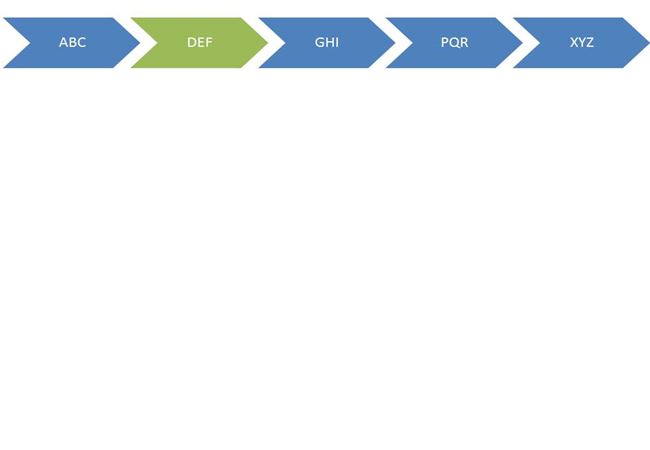
& so on..
Other Better ways for presenting 5 or more Agenda points are shown in images below.

In above format you can even insert hyperlinks (Select the text - Right Click on Mouse – Hyperlink option) for each slide in their respective geometrical boxes. i.e. for six points, I have used Hexagonal here. You can change it accordingly to give your slides a better view.
You can even include company logo to set your agenda slide. i.e. for HR policies at WalMart,

3) Planning your Presentation content
Follow this 3 point approach while planning your contents in a presentation:
I. Consider your audience
First decide who your audience is and decide ways to communicate your message to them. Sometimes you may need to express the same message in different ways for two different set of audiences.

II. Be coherent
Express your messages and draw your conclusions based on it in a coherent and logical flow. Your ideas should follow a coherent way for better understanding of it.

III. Develop your story-line
First decide what you’re trying to explain and how you’re going to do that. If you have a proper story-line for your presentation, It would become easy for your audience to understand the flow. If you’re not clear enough, build a story first using following principles.
- Planning your story-line by identifying key-messages and making slide titles according to that
- Writing your story-line using Pyramid principle.

Pyramid approach drives story-line and slide structure. It helps you organizing your story in either Top-Down or Bottom-Up approach.
4) Attentive & Pre-Attentive processing for Data visualization
Sometimes, you may have overload of data, stats, and figures to showcase in your slide. At that time, if you can’t play well with pre-attentive processing of human memory- your message may get completely lost. Color coding, proper highlighting of facts can help you deliver your message to the audience in an effective way. Certain examples are shown below.
1) BEFORE:

AFTER:

2) BEFORE:
AFTER:
(With certain highlighted areas- which we wanted to focus in presentation)
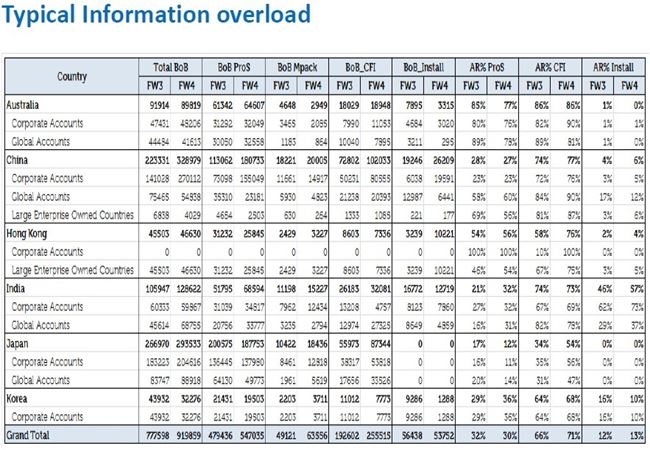
3) BEFORE:

Sometimes, too much of color coding and irrelevant highlighting creates only confusion in viewer’s mind.
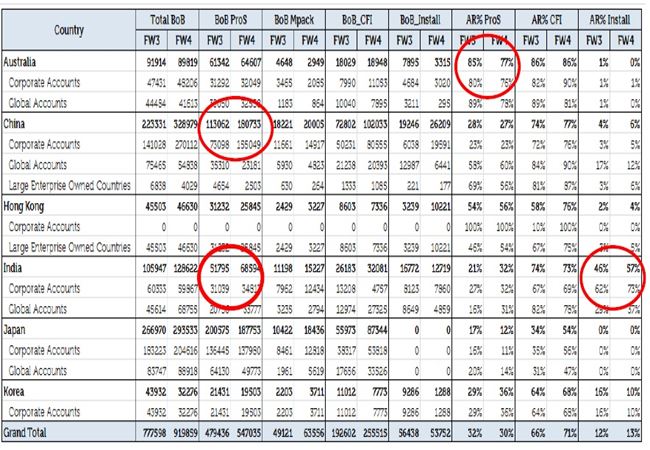
By putting ( ) sign for negative values, removing $ from each sale and just highlighting few of the important entries same table can be presented better as shown below.
AFTER:

5) Use of Images to convey your message
Images can sometimes present the same textual message more beautifully. Effective use of images also reduces your amount of text in a particular slide. It has been scientifically proved that images grab more attention than a normal highlighted text message. Some examples are shown below:
A)

B)

C)

6) Some DON’Ts while presenting Graphs in a presentation
1 Scientifically proved facts say: Human eye finds difficulty in reading/perceiving 3D charts.Always prefer to use 2D charts/graphs.
2 Studies have shown when reading graphs we can pre-attentively distinguish between 8 different hues, 4 different orientations, 4 different sizes only.
3 Avoid using more than 3 different colors in a particular slide.
4 Line/Bar graphs are always better than Area/Pie charts for better understanding of data.
5 As when the components are high, area/pie graphs present poor communication and are not as effective as normal Line/Bar/Stacked Bar graph.
6 Try to use variety of graphs such as Radar graph, Doughnut graph, Candle stick graph, Pareto chart, Bubble graph, Range bar and bridged graph. For their particular form of use, they are excellent way of communicating data to the audience.
7 Always convert multi digit numbers/figures into smaller multiples. (i.e. 2,40,000 can be effectively mentioned as 240K) It will also save lot of space in your graph presentation.


7) Use of Infographics and follow KISS principle
Whenever needed, always use smart art and infographics to present your message/data. Don’t fill up the entire space in slide with complex data and images. Prefer following KISS principle.
K- Keep
I-It
S-Simple &
S-Short
Use short & straight keywords in slide instead of using long paragraphs and complex sentences.
Certain examples of effective use of infographics are shown below:
A)

B)

C)

Source for Slide Snapshots: Author's Slideshare Account- www.slideshare.net/kashyapshah11