Pearson's Correlation Coefficient (r)
Definition & Meaning
This article covers meaning & overview of Pearson's Correlation Coefficient (r) from statistical perspective.
What is meant by Pearson's Correlation Coefficient (r)?
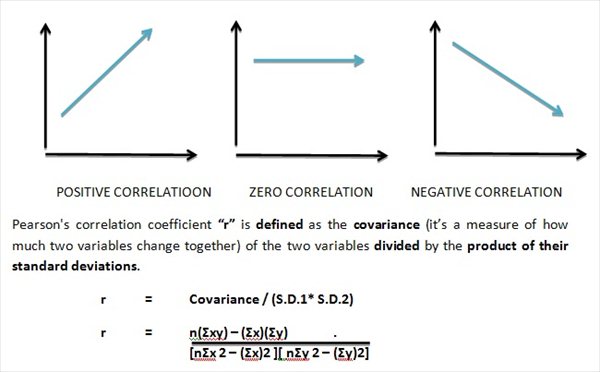
Correlation coefficients are used in statistics to determine how well the variables are related. The Pearson’s correlation coefficient is a measure of linear correlation between the two given variables. It is represented by either “r” (for sample) or by “ρ” (for population).
The range of Pearson’s correlation coefficient lies between -1 to +1.
Where, 1 is total positive correlation, 0 is no correlation, and −1 is total negative correlation.
Note: The Pearson correlation coefficient, r, does not represent the slope of the line of best fit. Say, if you get r= +1 this does not mean that for every unit increase in one variable there is a unit increase in another. It simply means that there is no variation between the data points and the line of best fit.
Example:
The real life application and example of Pearson’s correlation coefficient is below:
Once Scientists in China wanted to know if there was a correlation between spatial distribution and genetic differentiation in weedy rice populations. When they plotted the result of their observations on the graph and analyzed Pearson’s correlation between the two groups, they got a significant positive correlation between 0.783 and 0.895 for weedy rice populations.
Browse the definition and meaning of more similar terms. The Management Dictionary covers over 1800 business concepts from 5 categories.
Continue Reading: