Modern Trade Channel & Impact of Fill Rate
In the present era of high demand uncertainties and shorter product life cycles, all the FMCG companies are consistently trying to strengthen supply chain over demand uncertainties. Challenges gets more complex with numerous sales channels with different order management and supply dynamics. ‘Fill Rate’ is one of the performance indicator which indicates successful supply planning. Fill rate of any particular channel is percentage of placed orders converted in actual sales. Issues in data synchronization between sales and manufacturing departments, poor demand planning, logistics & network constraints, high volatility and uncertainty of the market causes low fill rates in retail sector
This case study involves analysis of modern trade fill rate issues of Wildcraft India Private Ltd. The analysis is done using tools like Cause and Effect diagram, Pareto Chart, Personal Interview and Risk Analysis. Discussion of this paper also includes suggestions to improve fill rate.
Image: pixabay
Wildcraft is one of fastest growing Indian company in sports gear manufacturing company. For the last couple of years it has grown approximately by 40% YOY. The company manages its sales through various sales channels. ‘Modern Trade’ is one of their major retail channel. Modern trade channel is basically point of sales of Wildcraft available at different Multi-Brand outlets. Currently Wildcraft has 21 active Modern trade partners which includes Big Bazaar, Lifestyle, Central, Shoppers Stop etc. Revenue wise Modern trade contributed to 14% of the sales revenue for FY 2015-16, which makes it one of the important channel. Business fill rate for this channel for FY 2015-15 was avg. 76%.
Fill rate is an important performance indicator of supply chain planning for any modern trade retail channel. Low fill rate means direct loss of sales revenue. But it also implies high probability of firm losing out customers to their competitors. Today’s extreme competitive environment pushes companies to perform complex tasks ranging from managing supply chain, handling new product introductions every season to managing electronic product catalogs. Such situations has made it difficult to maintain desired 90% fill rate for companies. Following work includes detailed look at the fill rate issues and how collaboration and strengthening stock planning helped the company to improve fill rate.
Process Analysis for MT partners
Process analysis was done on the basis of 6 months sales data of FY 2015-16. It was observed that one could see deltas between order quantities as it moves to further stages. Major process stages are represented in fig.1. Major gaps between the quantities can be categorized as customer service entry error or compromise for urgent cases, planning gap and warehouse picking issues. Representation of this delta is shown in the Fig. below.
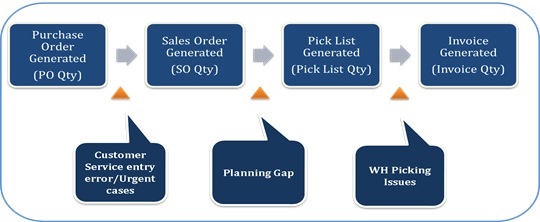
Figure 1: Major Process steps and quantity gap
Business fill rate i.e. overall fill rate can be further divided into ‘Planning Fill rate’ and ‘Warehouse Fill rate’. Planning fill rate is ‘pick list quantity’ to ‘purchase order quantity’ expressed in %. Pick list quantity is quantity which is mentioned in the warehouse pick list which indicates available stock availability for that particular SKU. So planning fill rate shows supply planning efficiency of the system.
Warehouse fill rate is ‘invoice quantity’ to ‘pick list quantity’ expressed in %. Warehouse fill rate shows that out of available stock at warehouse what percentage were able to convert into fulfillment of order (invoice quantity). Factors affecting warehouse fill rate are stock cannot be found physically though it’s available in the system, wrong barcode issues, damaged goods etc.
Figures for all fill rates are shown in the table below:
Table 1: Fill Rates for Modern Trade (Q4 FY 2015-16)
|
Fill Rate (%) |
Jan |
Feb |
Mar |
Avg. |
|
Business Fill Rate(1+2) |
93 |
63.7 |
81.9 |
79.5 |
|
WH Fill Rate(1) |
98.7 |
90.9 |
90.3 |
93.3 |
|
Planning Fill Rate(2) |
94.1 |
70.1 |
90.6 |
84.9 |
From different fill rates it can observed that there is lots of scope of improvement in planning fill rate. And if planning fill rate is improved then achieving desired 90% fill rate, becomes easier.
But while assessing the scenarios, analysis is not confined to sales order data only. To understand every concern area it was necessary to take feedback of Modern Trade stakeholders from different functions.
A questionnaire was prepared which had questions regarding order fulfillment process. Through this questionnaire one to one interviews were conducted across all the functions: sales team, supply chain etc. All the essence of this interviews were converted in the form of Fish Bone diagram. Fish bone diagram is a qualitative tool used to do in - depth root cause analysis. Typically a fish bone diagram lists issues under man-machine-material-environment subcategories. But for the sake of simplicity and case relevance, fish bone was mainly divided into ‘Planning Issues’ and ‘Execution Issues’. Fish Bone diagram is shown in Annexure 1.
It was decided to assign ‘Risk Priority Number’ to each issue to quantify this issues. A RPN number denotes how risky a particular failure mode is and it is expressed in terms of 3 parameters; severity, probability of occurrence and detection. Ratings given to these parameters are mentioned in Annexure 2:
After giving RPN number to all the issues they were categorized into 4 categories mentioned in the table further.
Table 2: Summary of Risk Analysis
|
RPN |
No.
of Issues |
Controllable |
|
Greater than 400 |
4 |
4 |
|
250<RPN<400 |
7 |
5 |
|
150<RPN<250 |
8 |
7 |
|
RPN<150 |
5 |
2 |
|
Total Issues |
24 |
18 |
After assigning risk priority number to all 18 issues, it was decided to suggest solutions on main two areas:
1. Safety Stock Planning
2. Demand planning collaboration
Recommendations
1. Safety Stock Mapping:
Safety stock is nothing but keeping buffer stock to ensure stock availabilities against sudden uncertainties in demand, supply, delivery and manufacturing. Safety stock level must be high enough to cover delivery times, sufficient enough to cover customers’ demand, but not so high that company loses money because of high carrying costs.
Wildcraft formally does not hold any safety stock for any of their sales channel. From different fill rate trends it was clear that if proper stock management is done then planning fill rate will be increased significantly leading to increase in overall fill rate. Dynamic safety stock model was proposed for Wildcraft which is based on past one year historic sales data, seasonality factors and future sales projections. So at the end of every month, the company will have revised and optimized safety stock levels (SKU wise).
2. Demand Planning Collaboration with MT partners:
Detailed ‘Process Gap analysis’ was done to identify all the process related issues which were impeding planning. In process gap analysis it was clear that some of process issues can be cleared from MT partner’s buyer side. Those were taken up with them.
E.g. To ensure proper stock management, secondary sales data trends are need to be updated ideally after every 10 days. But Big Bazaar used to share this data only once in a month. This issue was taken up with them
Another internal issue which came forward was that there was no formal production planning review, where as per the changing sales trends, production planning can be altered. Such planning mechanism was established on bimonthly basis. Agenda of this production planning review mechanism is whether there is need of additional indenting (additional production of particular SKU).
In this bimonthly review, decisions are taken regarding additional indenting for production (SKU wise) considering following parameters:-
- Weekly sales through data
- Sales Projection from buyers
- SOH(Stock on Hand) status
Conclusion
With data analysis and process root cause analysis it was observed that issues lies in the supply planning area. Main project objective was to establish improvement mechanism to increase fill rate. Through dynamic safety stock planning and bimonthly production planning review it can be increased significantly.
Achieving fill rate of more than 90% is not an easy task even for well-established leading retailers. But still higher rates can be achieved through collaboration and stock planning as described in this case. When all the suggested improvements were simulated though past data it was observed that average 5 % fill rate improvement was easily possible in each month. It translates 15-20% direct increase in sales revenues.
Fill rate is a strictly supply chain measure which indicates a robust supply-demand planning. Ulterior motive should not be to increase a ‘rate’ but to increase customer satisfaction by increasing availability of products and hence tapping more customer satisfaction.
This article has been authored by Rasika Wanganekar of SIBM Bengaluru
Annexure
Annexure 1: Fish Bone diagram for order fulfillment issues
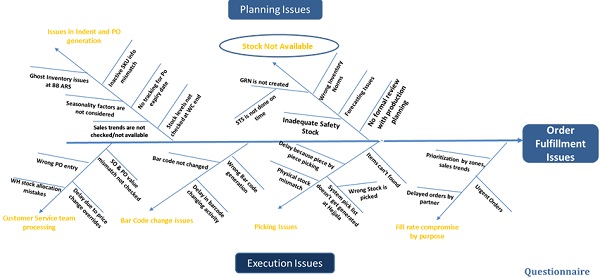
Source: Author’s Contribution
Annexure 2: Ratings for Risk Priority Number
|
Probability |
Severity |
Detection |
|||
|
Scores |
Parameter |
Scores |
Parameter |
Scores |
Parameter |
|
1-3 |
Very Low |
1-3 |
Very low/None |
1-3 |
Very Easily |
|
3-5 |
Low |
3-5 |
Minor |
3-5 |
Easily |
|
5-7 |
High |
5-7 |
Moderate |
5-7 |
Unlikely |
|
7-10 |
Very High |
7-10 |
High |
7-10 |
Very Unlikely |
|
Probability |
Severity |
Detection |
|||
|
Scores |
Parameter |
Scores |
Parameter |
Scores |
Parameter |
|
1-3 |
Very Low |
1-3 |
Very low/None |
1-3 |
Very Easily |
|
3-5 |
Low |
3-5 |
Minor |
3-5 |
Easily |
|
5-7 |
High |
5-7 |
Moderate |
5-7 |
Unlikely |
|
7-10 |
Very High |
7-10 |
High |
7-10 |
Very Unlikely |