Histogram
Definition & Meaning
This article covers meaning & overview of Histogram from statistical perspective.
What is meant by Histogram?
Histogram is a pictorial representation method of grouped statistical data. ‘Grouped’ implies the clustering of data with similar attributes or values into ‘classes’. The advantage of such a representation is its pictorial appeal wherefrom one can assess the nature of behaviour of a variable and is hence useful in predicting the probabilistic distribution of this variable.
Example:
Say we consider a class of 20 students as our data set. We want to represent the distribution of marks obtained out of 100 by them in the last annual examination as given by a histogram.
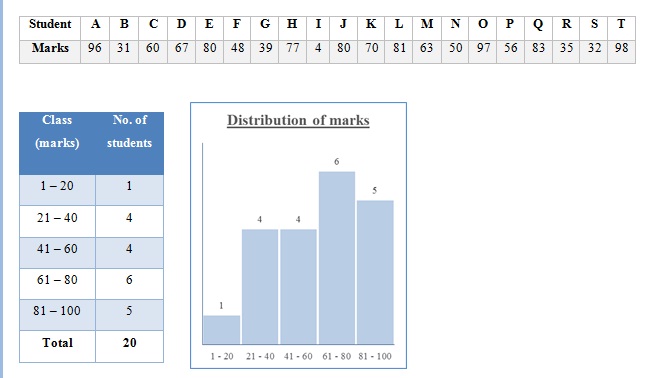
We construct a grouped table as on the extreme left with, say, 5 classes or groups of marks, each of width 20 and count the number of students in each class. Then we plot a graph of the same as besides, called the histogram. Along the x-axis, marks are plotted while the number of students is along the y-axis. The width of each bar is the width of the class while the height represents the number of students in the class.
Browse the definition and meaning of more similar terms. The Management Dictionary covers over 1800 business concepts from 5 categories.
Continue Reading: