Index Plot
Definition & Meaning
This article covers meaning & overview of Index Plot from statistical perspective.
What is meant by Index Plot?
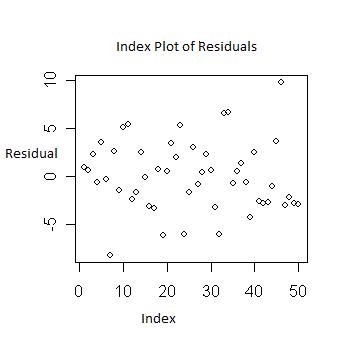
A plot of the residual, leverage or the Cook’s distance against the corresponding observation number (row, i or index) in the dataset is known as an Index Plot in statistics. Residual (or error) is any unexplained variation after fitting a regression model. The Cook’s distance is the influence of a data point when performing least squared regression analysis. In many cases, the row or the index number corresponds to the order in which the data is collected. If that is the case, then the plot is similar to plotting the residuals against time.
The index plot is particularly applicable to normal linear and particularly generalized linear models facilitating the detection of both outliers and influential points. If a residual index plot is showing a trend, then in that case they are not independent. Index plots play a very vital role when the data is in time, hence, resulting in detection in patterns in residuals.
Diagram:
Browse the definition and meaning of more similar terms. The Management Dictionary covers over 1800 business concepts from 5 categories.
Continue Reading: