Residual Plot
Definition & Meaning
This article covers meaning & overview of Residual Plot from statistical perspective.
What is meant by Residual Plot?
The Residual Plot is graph which is used to check whether the assumptions made in a regression analysis are correct. It is a graph plotted between the residuals for a particular regression model and the independent variable.
The residuals are calculated as the difference between the expected value & actual value of the dependent variable. The Expected value is calculated by substituting various values of the independent variable in the developed regression equation. It will be observed that the sum of residuals will be equal to zero.
Residual (e)=Actual value (y)-Expected value (y')
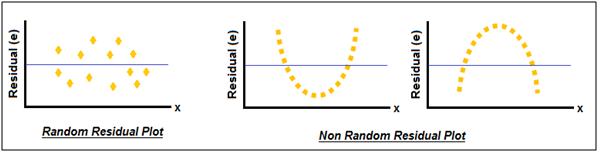
Based on this, a residual plot is constructed with the independent variable (x) on the horizontal axis & the residuals on the vertical axis.
Assumptions are made in while developing regression analysis that the model is linear, error terms are independent and have constant variances. By observing the residual plot, one can conclude whether the assumptions made are valid or not. If the residual plot is randomly distributed, it shows that the assumption that the regression model is linear is correct. But if the residual plot exhibits a certain type of pattern, then the assumption is not correct.
Browse the definition and meaning of more similar terms. The Management Dictionary covers over 1800 business concepts from 5 categories.
Continue Reading: