- Business Concepts ›
- Operations and Supply Chain ›
- Control Charts
Control Charts
Definition & Meaning
This article covers meaning & overview of Control Charts from operations perspective.
What is meant by Control Charts?
It is a process control tool to know whether the process is under statistical control or not. This technique was developed by Walter A. Shewhart at Bell laboratories in 1920s.
These control charts are used to monitor the variance in product/service. The productivity and quality is increased as the operators and managers will know when the process is getting out of control.
There are 2 types of control charts:
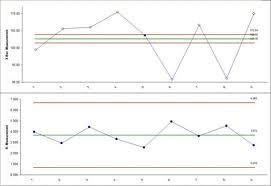
1, x bar r charts: These charts are used to measure the variance of product characteristic. . It is used when the product attributes are measureable. It is computed by analysing small random samples over a period of time.

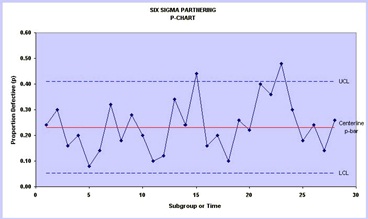
2. p charts: These charts are used to see the attribute compliance. When the product attributes do not yield any measurement but only a ‘yes or no’ answer/conclusion, these charts are used. It graphs the proportion of sample items which are not in compliance with the specifications.

This article has been researched & authored by the Business Concepts Team which comprises of MBA students, management professionals, and industry experts. It has been reviewed & published by the MBA Skool Team. The content on MBA Skool has been created for educational & academic purpose only.
Browse the definition and meaning of more similar terms. The Management Dictionary covers over 1800 business concepts from 5 categories.
Continue Reading:
What is MBA Skool?About Us
MBA Skool is a Knowledge Resource for Management Students, Aspirants & Professionals.
Business Courses
Quizzes & Skills
Quizzes test your expertise in business and Skill tests evaluate your management traits
Related Content
All Business Sections
Write for Us