Fishbone Diagram
Definition & Meaning
This article covers meaning & overview of Fishbone Diagram from operations perspective.
What is meant by Fishbone Diagram?
Fishbone Diagram is one of the seven Quality control tools which is used to analyse a problem by identifying its possible causes. It is also called as Cause-and-effect diagram or Ishikawa diagram. It is called as ‘fishbone’ because the diagram looks like a fish spine with ribs branching out. This tool was created by Kaoru Ishikawa, a pioneer of quality management in 1960’s.
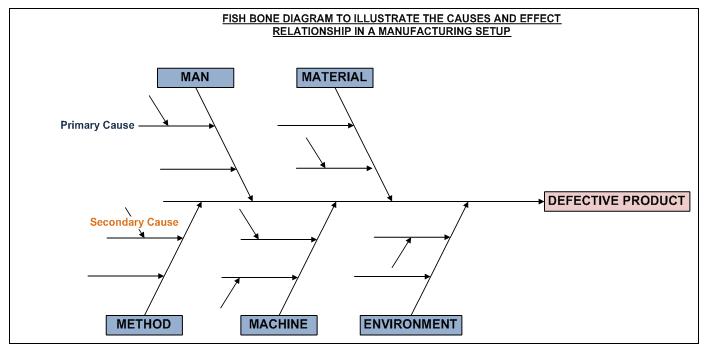
A typical Fishbone diagram looks as below:
The following are the steps to make a Fishbone diagram:
- Identify the problem situation that is faced
- Determine the factors that can be attributed to the problem
- For each of the factor, identify the possible causes to the problem
- Analyse the diagram
Different factors can be used to determine the cause of the problem depending on context. In manufacturing setup, one can use factors like Man, Machine, Material, Method, Measurement and Environment. It can also be used in service, financial, marketing context also.
Browse the definition and meaning of more similar terms. The Management Dictionary covers over 1800 business concepts from 5 categories.
Continue Reading: